• Skip to primary navigation
  • Skip to main content
TTI Logo

Center for Railway Research

  • Home
  • About Us
  • Research Topics
  • Connections
  • People
  • Directory

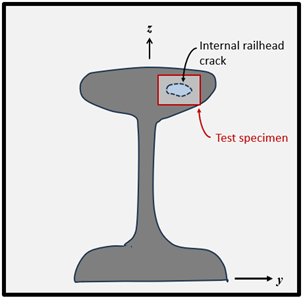
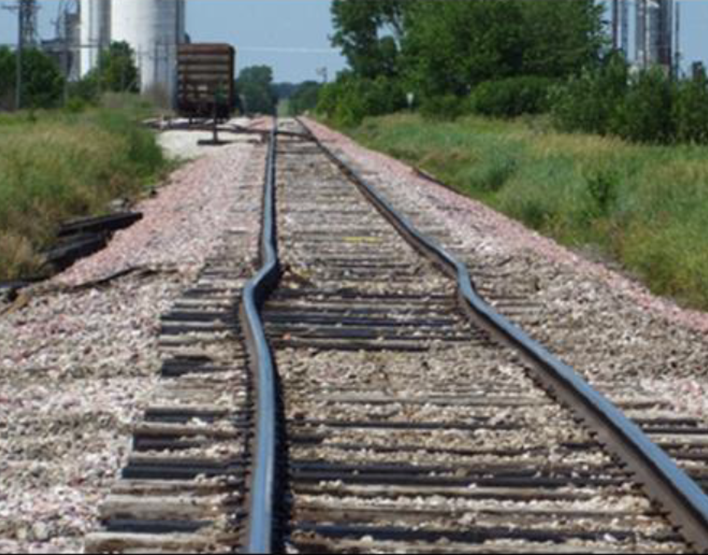
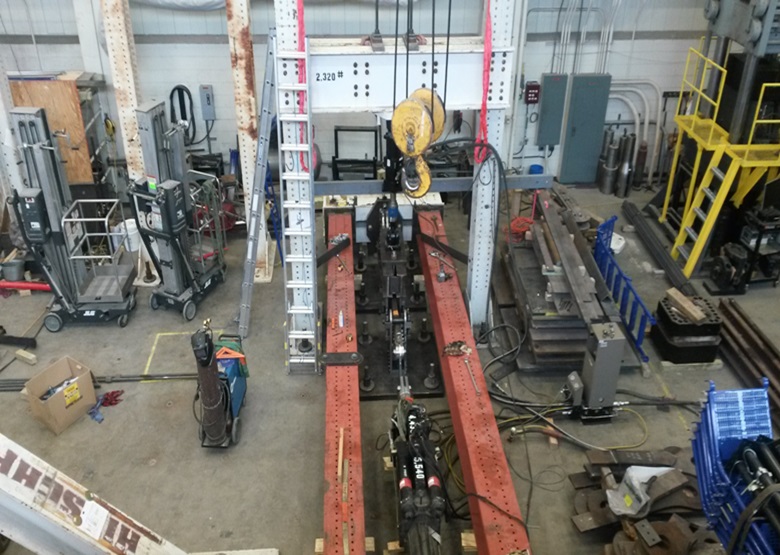
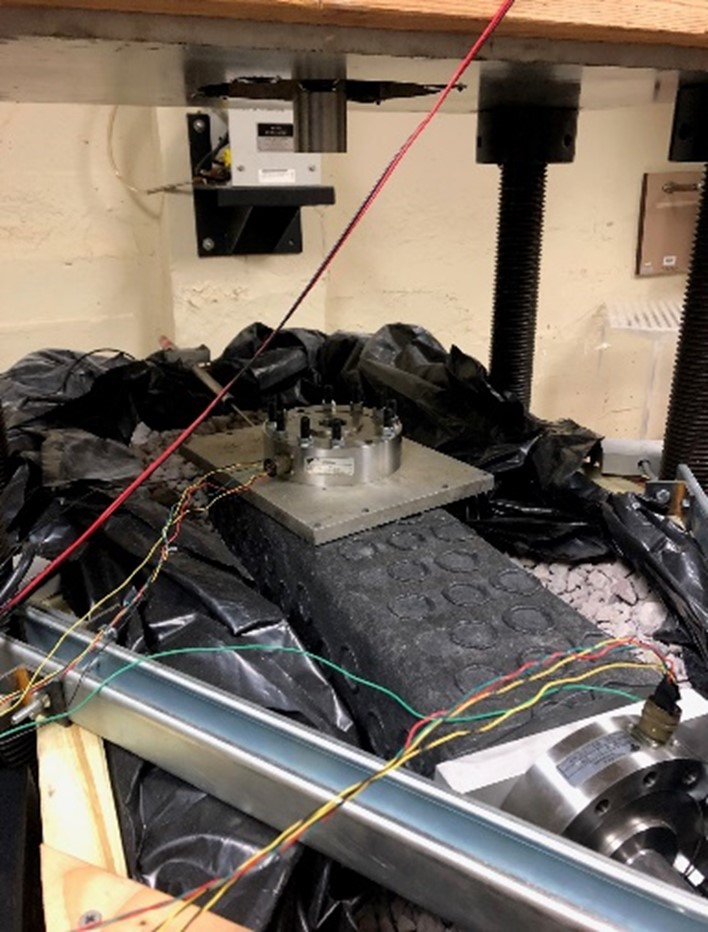
Center for Railway Research

Studying, developing, and applying new and emerging technologies to solve rail industry problems.

Research Topics

Illustration of a railhead with labels for internal railhead crack, test specimen, and the x and z axes.

Computational Modeling of Fracture in Rails 

Computer Prediction of Buckling in Rails 

Experimental Determination of Crack Growth in Rails Subjected to Long-Term Cyclic Fatigue Loading 

Experimental Determination of Track Structure Properties 

Visuals

Photos

  • Illustration of railhead with labels identifying: uniaxial cyclic loading simulating rail cars and RNT, internal railhead crack, and the x, y, and z axes.
  • Photograph with the following items identified: vertical load actuator, horizontal displacement LVDT (vertical displacement LVDT not show in photo), vertical load cell, crosstie (shown: HDPE with dimples), aggregate (and plastic shown for wet experiments), pusher load cell, and pushing actuator.
  • Illustration of a railhead with labels for internal railhead crack, test specimen, and the x and z axes.
  • Photograph of a broken rail.
  • Illustration of a railhead with labels for internal railhead crack, test specimen, and the x, y and z axes.
  • Illustration of a railway with labels for cross ties, track fasteners, damaged rail, ballast, base material, and the x, y and z axes.
  • Rail Tests/Simulations

    • Rail test graph example.
    • Rail test graph example.
    • Line graph showing crack area vs. kilocycles for Rail numbers 1, 4, 5, 6, and 7.
    • Line graph showing buckling load vs. lateral trackwalk change for delta T equals 0, delta T equals 15, and delta T equals 30 degrees Fahrenheit.
    • Line graph showing tie force [kips] vs. tie displacement [in].
    • Line graph showing buckling load vs. rotational stiffness change - lift off.
    • Line graph showing buckling load vs. rotational stiffness change.
    • Line graph showing lateral buckling load vs. temperature change.
    • Comparison of crack progression in each rail tested.

    Texas A&M Transportation Institute

    3135 TAMU

    College Station, TX 77843-3135

    (979) 317-2000

    State Resources

    The State of Texas

    Texas Homeland Security

    Texas Veterans Portal

    State Expenditure Database

    Statewide Search

    State Auditor’s Office Hotline

    Policies

    TAMUS Risk, Fraud & Misconduct Hotline

    Site Policies

    Open Records Policy

    Statutorily Required Reports

    TTI Rules

    Veterans

    Equal Opportunity

    Jobs

    A member of the Texas A&M University System

    © Copyright 2025 Texas A&M Transportation Institute (TTI)